

Early in my career as a UX designer on the e-commerce team at Beckman Coulter, I worked on a problem that shows up in almost every industry: customers were stitching together too many logins, screens, and handoffs just to get one job done. One lab supervisor put it plainly: “There are too many login authentications. I find it difficult to locate my purchases and training materials.”
This is the story of how our team turned a fragmented buying experience into one place to buy, monitor, and maintain lab equipment, and what I carried from it into the work we do at DesignLingo.
The problem: a journey with no through line
Product discovery was weak, and the path from research to procurement was disconnected. Once an instrument was bought, buyers had no way to see how it was performing. There was no single source of truth for login, performance, maintenance, or analytics.
My role on the team
This was a team effort across marketing, development, customer experience, content strategy, and market research. I led user research and journey mapping, designed the application experience, and worked with development and tech support to define what the interface could realistically do.
Start with the people, not the screens
We opened with a three day Kaizen workshop with everyone in the same room. By the end, the team agreed on how buying really works, we had a user journey map showing where buyers struggled, and we had an early sketch of a centralized dashboard.
I followed that with user interviews and affinity mapping, and used analytics to see how different personas engage. A rapid Figma prototype let us test the dashboard idea early.
The pivot that changed the design
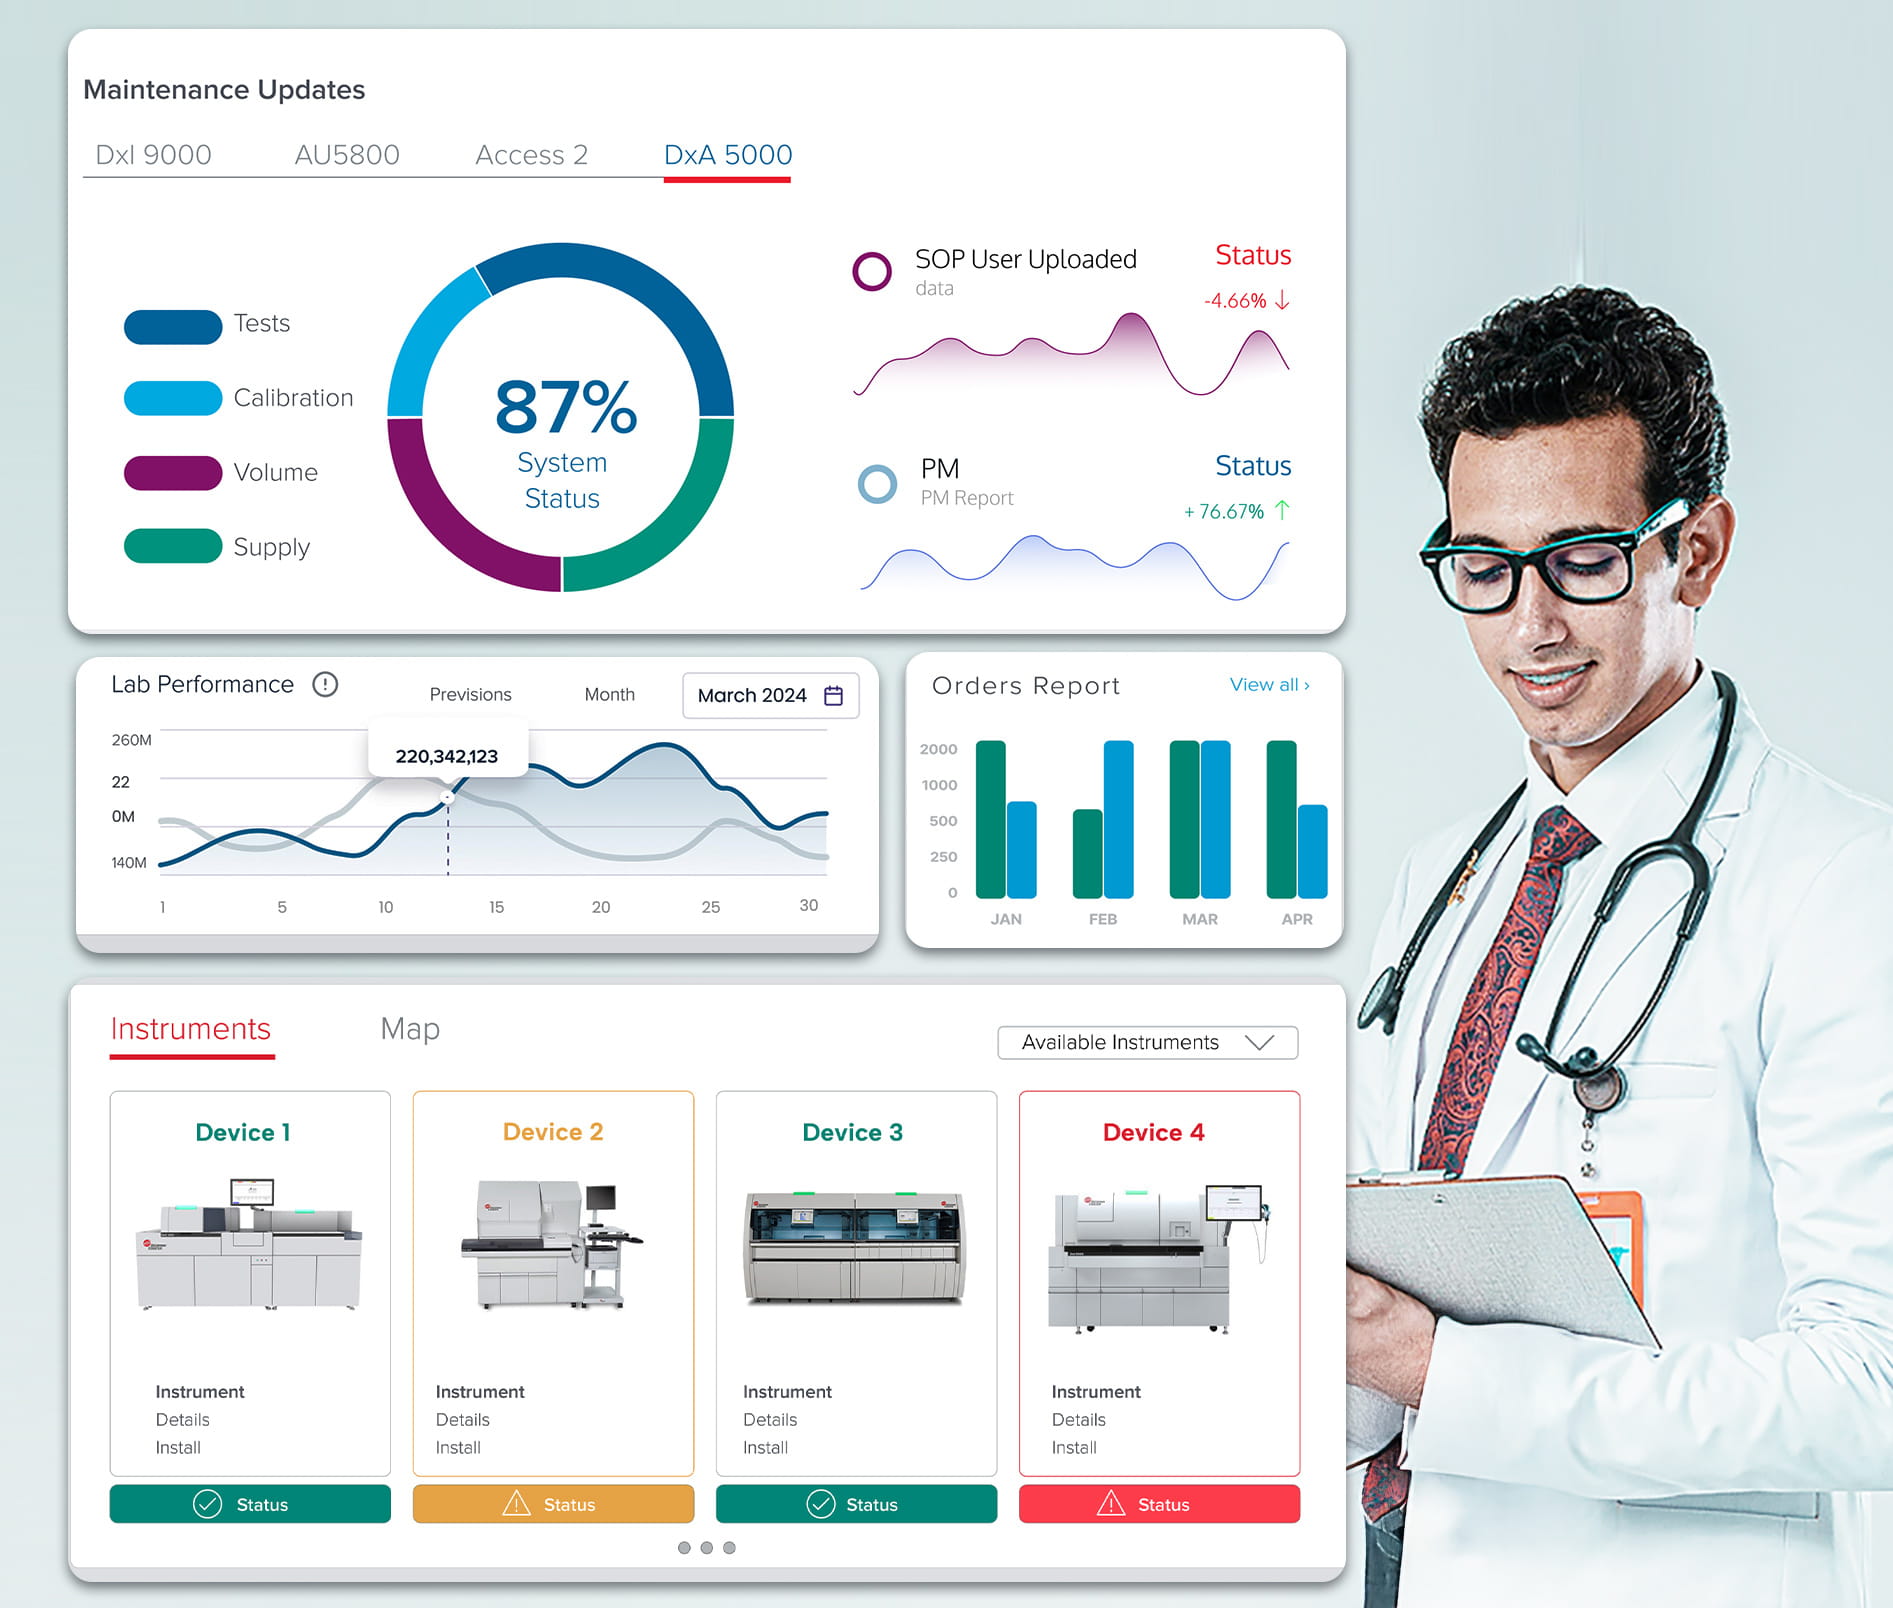
Our first designs centered on purchase history. User testing showed us something more useful: people did not just want a record of what they bought. They wanted support and live visibility into the equipment they were already running. So the dashboard grew from a history page into a working tool, with real time instrument status and performance analytics.
What the team delivered
- A unified dashboard with real time instrument status and performance analytics
- Maintenance scheduling and service history in the same view
- One personalized sign in based on lab type
- UI elements defined with tech support so they could actually be built
Key Metrics
Business and User Impact
Platform improvements drove a 25% increase in conversion rate, translating design success directly into business gains.
The takeaway
- Specialized users need specialized experiences. Personas behaved differently from lab to lab, so one generic flow was never going to work.
- Support belongs inside the buying flow. Users wanted live chat and direct connection to technical support during complex purchases.
- One dashboard beats five tools. People consistently preferred a single place to monitor the whole lab.
- The gap between sales and onboarding is where the opportunity is. That low point is the next place to improve.
Want a similar experience for your company?
If your customers are juggling several tools, logins, or handoffs to get one job done, there is likely a simpler path. See how DesignLingo can help create a similar experience for your company.